
I was today days old when I learned that there’s an independent college basketball ratings site that builds every team rating from the players up — and that, two games into the 2026-27 season, it will cheerfully tell you its own numbers are still mostly a preseason guess. Roster Math (rostermath.win) describes itself as an “independent college basketball ratings system, built from the public record and run by its author.” It covers all 365 men’s Division I teams and 5,193 rated players (the top 300 are published), updates its ratings and picks every morning, and posts as @Roster_Math on X. What drew me in is the timing: watching a model in the first week of a season is like watching a weather forecast before the clouds show up. The interesting part is how it plans to learn. Source: Roster Math.
The roster doesn’t sit still anymore
College basketball rosters now turn over heavily every offseason through the transfer portal, and — this is my framing, not the site’s — the NIL era has only made movement easier, so a team’s identity in November can look nothing like the one that finished in March. That makes the old habit of rating a team mostly on last season’s results feel increasingly shaky, and it’s what makes Roster Math’s approach fit the moment. Its philosophy page calls the idea “from the roster up”: rate the players, then add them together, minutes-weighted. The site is candid that team results are the only clean ground truth — a team plays about 30 games, a box score is “a noisy shadow,” lineup data is thinner, and a recruiting rank is “a guess about a 17-year-old.” So it imposes a test on itself: when a team’s players are rated and summed, the sum has to match how the team actually played, because “a player model that cannot pass that test is not describing players.” Source: Roster Math (Philosophy page).
The scale is simple once you know it. A team rating is points per 100 possessions better than an average D1 team on a neutral floor (+30 is elite, 0 is average), split into offense and defense halves, adjusted for opponent and venue, shrunk toward a prior, with a bit of three-point luck removed and tempo modelled separately. A player rating is the same idea while he’s on the floor, and his “contribution” is that rating times his projected share of a rotation slot. Source: Roster Math (Philosophy page).
Who returns, who transferred in, who is a freshman
Before the first game, the site has to put a number on every one of those 5,193 players, and its philosophy page frames the whole thing as a shrinkage problem: the less evidence on a player, the more the prior wins. Returning players get their own record, shrunk by minutes played, with some patterns baked in — good freshmen keep improving, good seniors regress harder, about 40% of a one-season spike is given back, and recruiting pedigree “still says something years later.” Transfers get their old-school record with the level change priced in, plus one honest adjustment: “transfers as a group have slightly under-delivered their projections, and the model knows it.” Freshmen are projected from recruiting rank and their place in preseason NBA mock drafts, which the site says is the better signal at the very top. JUCO, international and D-II arrivals get a careful prior, and for the few projected to matter, a hand-written one with its source noted. A second model projects minutes, with a cap (nobody plays the 85% the projection would like) and a squeeze on deep rosters, because “the tenth man on a loaded team does not play.” Source: Roster Math (Philosophy page).
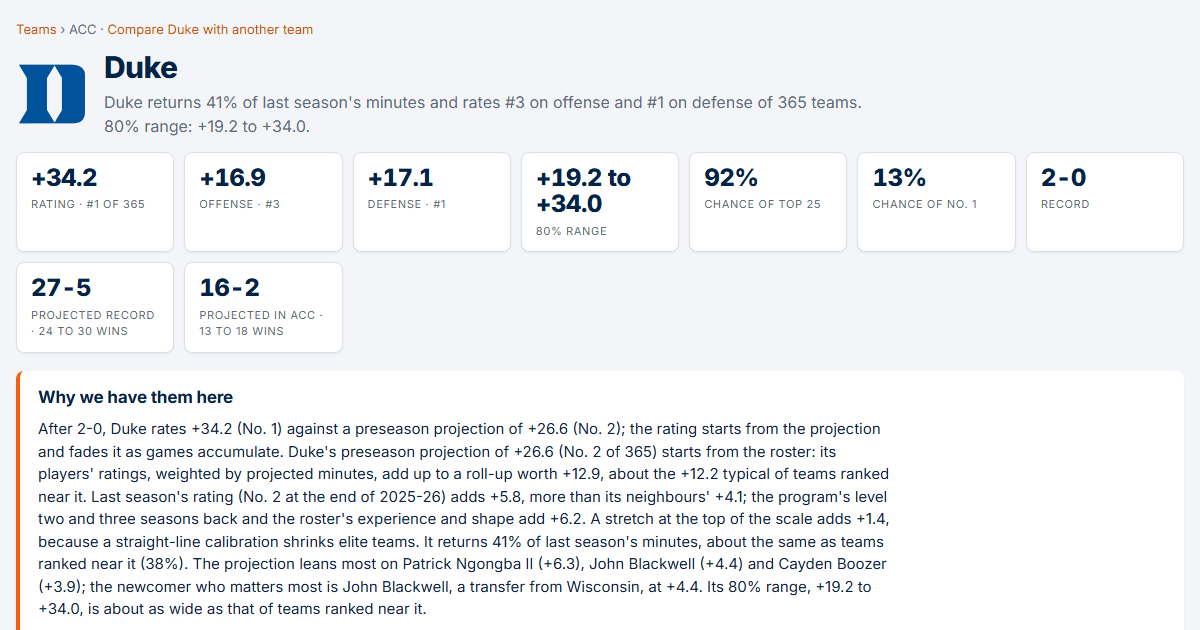
Duke is a tidy illustration of how much roster shape matters now. The site’s team page notes the Blue Devils return just 41% of last season’s minutes, and the three players it leans on most are a returner, Patrick Ngongba II (+6.3), a transfer in from Wisconsin, John Blackwell (+4.4), and Cayden Boozer (+3.9). That’s the modern roster in miniature: who stayed, who arrived, who’s new. Source: Roster Math (Duke team page).
It’s early — and the model knows it
Here’s the part I found genuinely clever. The site doesn’t throw the preseason projection away when the games start. According to its philosophy page, the projection becomes the prior of the in-season rating, worth about eight games of evidence, and it fades as real results accumulate. A player’s rating, likewise, blends his projection with his box score to date in proportion to how much each has to say. Two or three games in, that means the projection is still doing most of the talking — which is the honest answer to “how good is this team?” in the second week of November. Every morning the ratings update and the prior loses a little more of its grip. Source: Roster Math (Philosophy page).
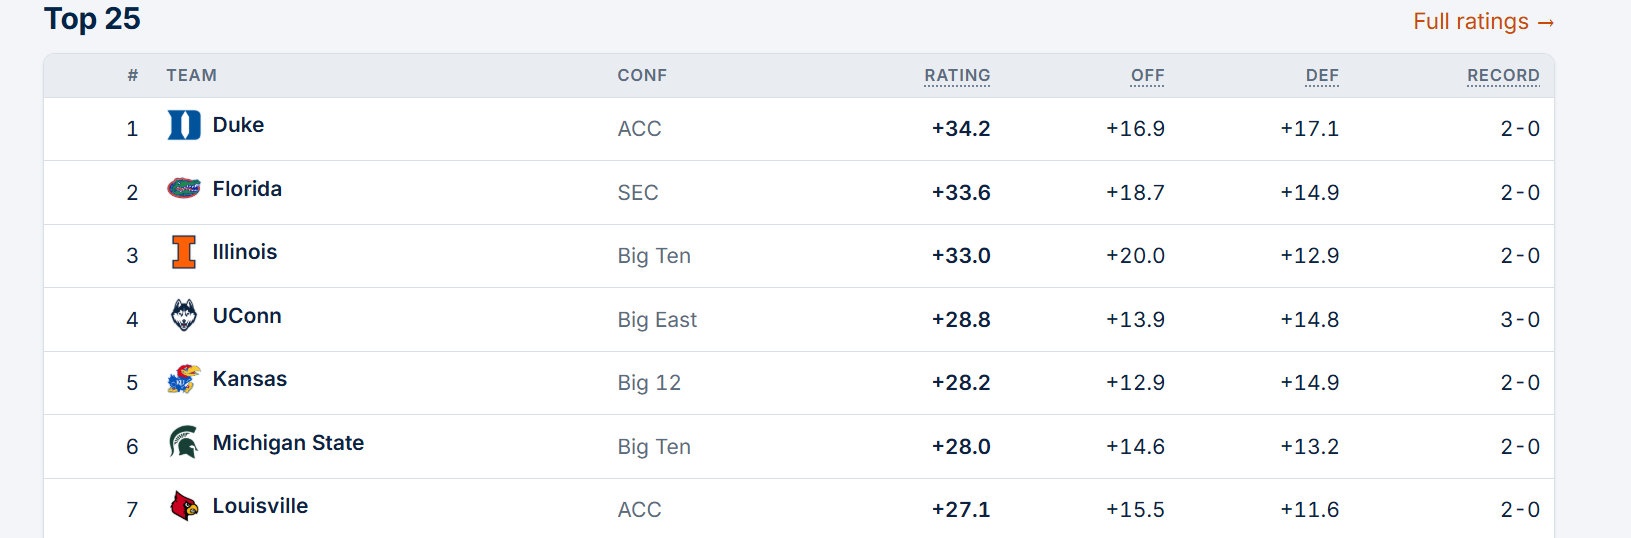
Duke shows the gears turning. The preseason projection had the Blue Devils at +26.6 and No. 2, with an 80% range of +19.2 to +34.0, a 92% chance of finishing top 25, a 13% chance of finishing No. 1, and a projected 27-5. As of November 10, after a 2-0 start, the in-season rating read +34.2, No. 1 of 365, with the No. 3 offense (+16.9) and the No. 1 defense (+17.1). My reading, not the site’s: that jump is two strong games pulling against a prior that still counts for roughly eight, not a verdict that Duke is a juggernaut. The site’s own line is that the rating starts from the projection and fades it as games accumulate, so in a month the same page will look different without anyone editing it. Each team page also carries a generated “Why we have them here” paragraph breaking the projection into its terms (for Duke: roll-up +12.9, last season’s rating +5.8, program history and roster shape +6.2, and a +1.4 “stretch at the top” because a straight-line calibration shrinks elite teams), which the site says is “generated from the published projection’s own terms, not written by hand.” Below it sits the full schedule with a projected margin and win probability for every game — Duke +4.5 and 65% against No. 6 Michigan State on a neutral floor November 10, -6.6 and 28% at Florida on December 1. The home page’s top five that morning: Duke +34.2, Florida +33.6, Illinois +33.0, UConn +28.8, Kansas +28.2. Source: Roster Math (Duke team page and home page).
The honest hedge
Everything above is the site describing itself. Its claim that eight teams in ten landed inside their 80% range over the seasons it was tested on is its own backtest, which I haven’t audited, and the site doesn’t name its author. The site also runs a Betting page that publishes daily picks under one fixed rule, graded against both the final score and the closing line; I’m not endorsing any pick, and nothing here is betting or financial advice. All figures are as of November 10, 2026, and because of how the model works, they are already out of date — which is sort of the point. The morning updates are slowly burying the prior under real games, so the ratings keep learning as the season goes. For a sport where the roster you’re rating may not exist in six months, that’s about as honest a way to do it as I’ve seen.