
I was today days old when I learned that one small Texas county has more wind turbines packed into it than anywhere else in North America — and that for a stretch in 2008, that one county alone out-generated the entire state of California in wind power.
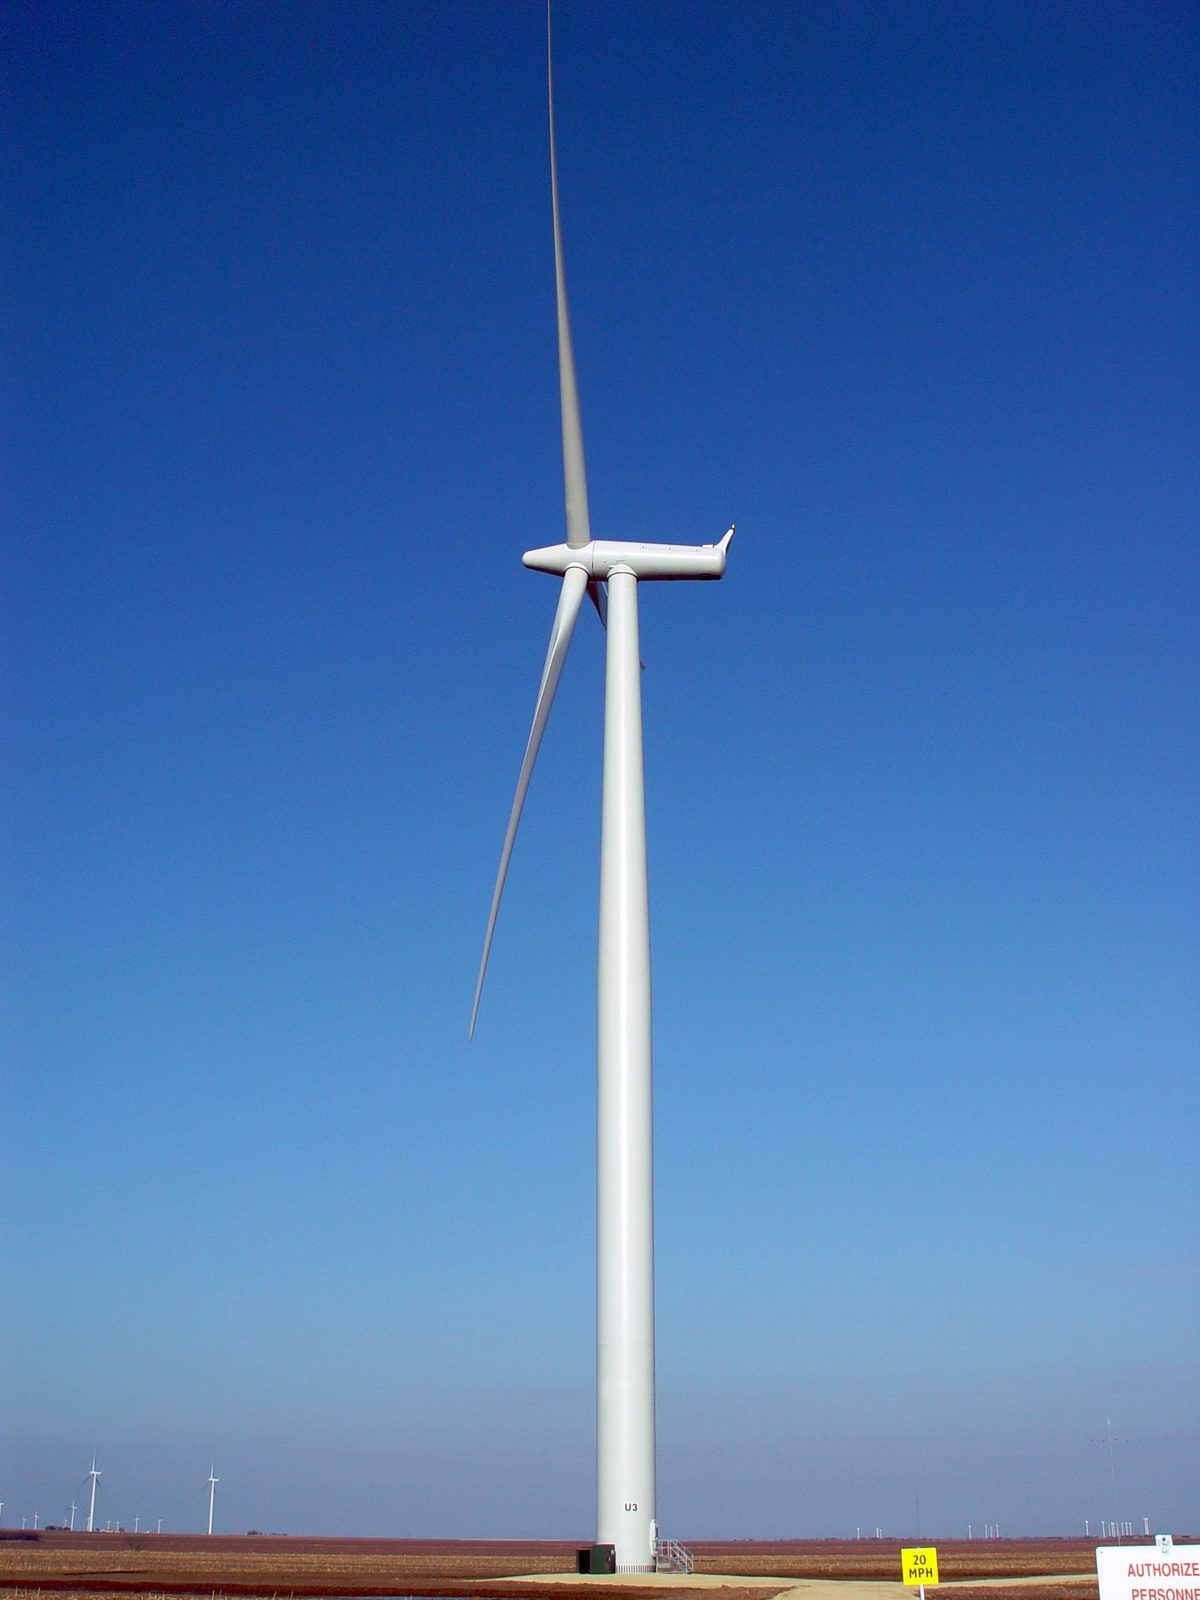
The county is Nolan County, home to the town of Sweetwater, and it genuinely holds the highest concentration of wind turbines anywhere in North America. The Sweetwater Wind Farm itself has a nameplate capacity of 585.3 megawatts across 392 turbines, built in five separate phases using GE, Siemens, and Mitsubishi turbines, and fully commissioned in 2007. It’s now owned by Duke Energy and Infigen Energy. Source: Wikipedia, Sweetwater Wind Farm.
That density adds up fast. As of July 2008, Nolan County alone was generating more wind energy than the entire state of California — and if the county were counted as its own country, it would have ranked 6th in the world for wind power generation. Sources: The Center for Public Integrity and Wikipedia, Nolan County, Texas.
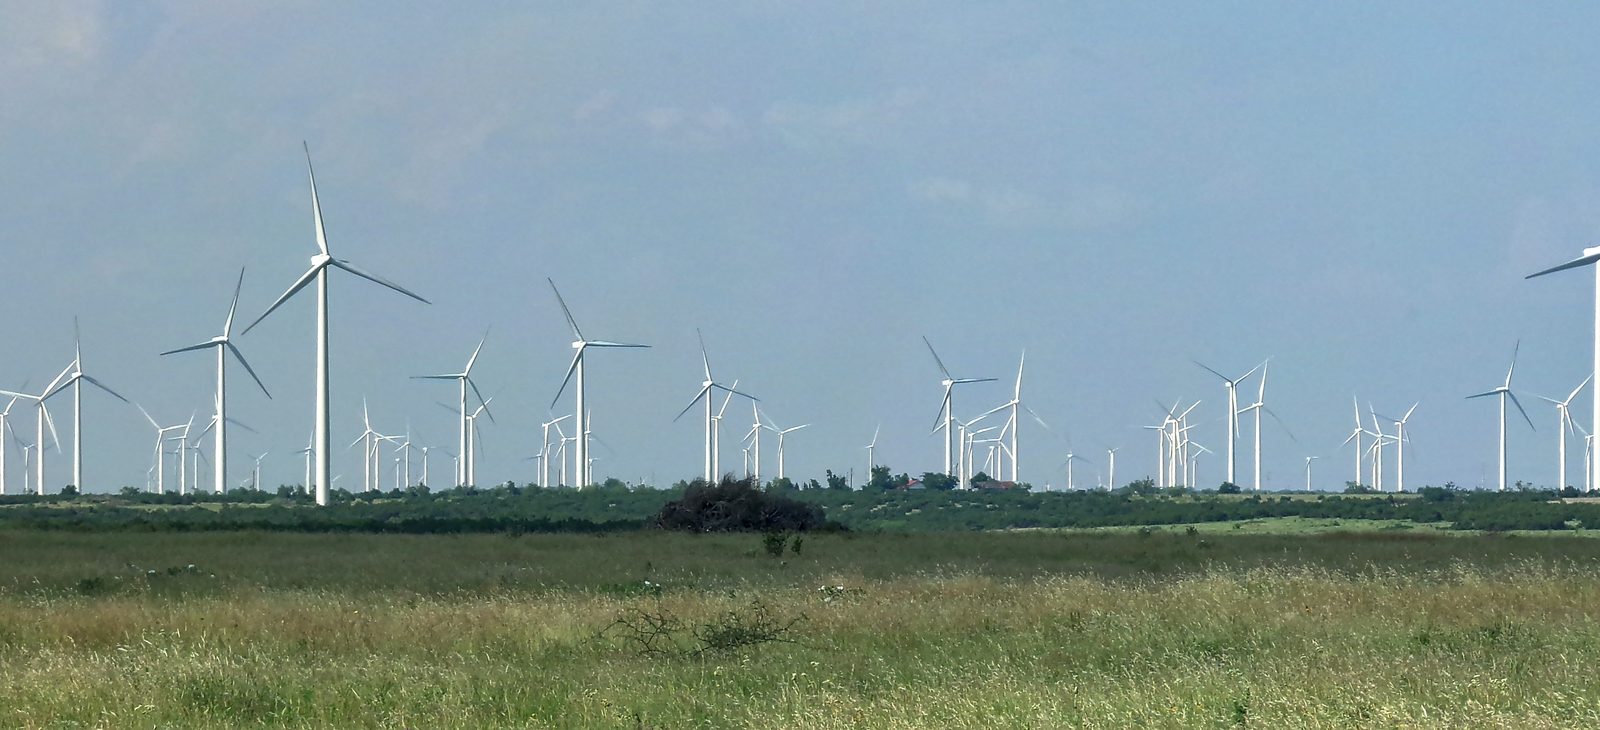
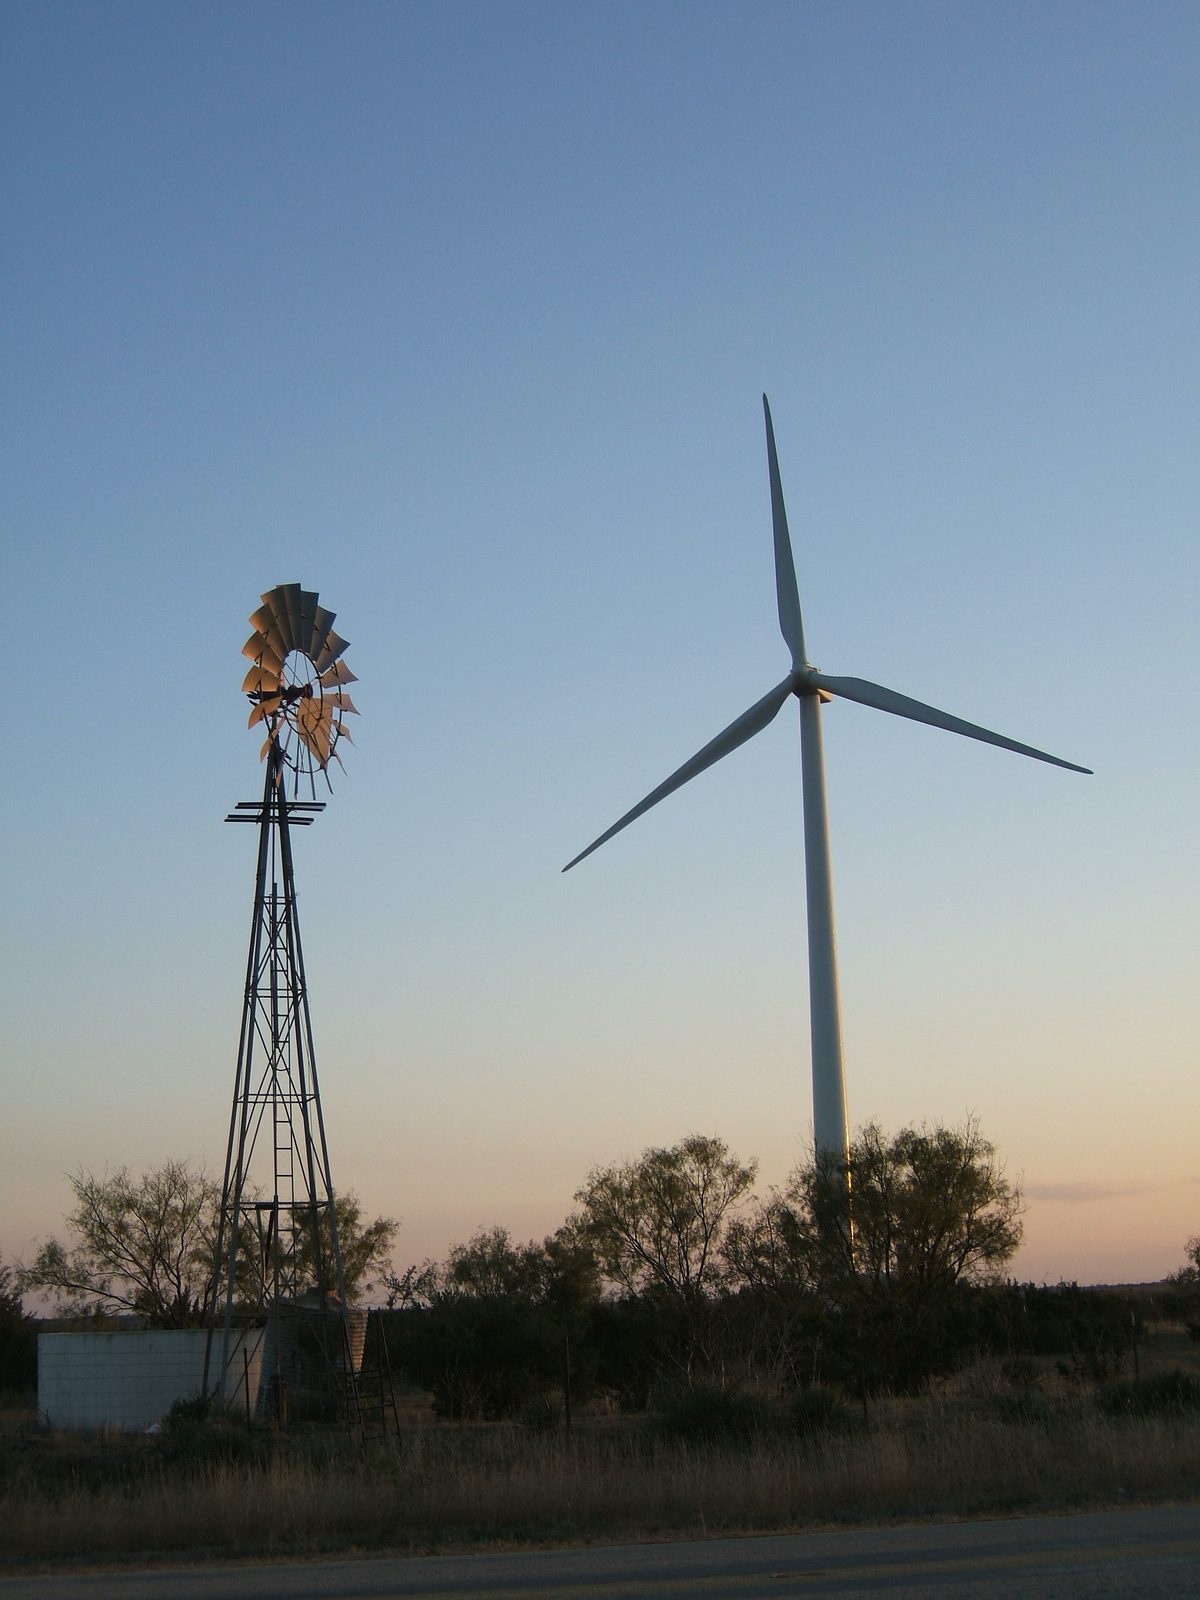
What makes the scale of it stand out even more is how small the town at the center of it has stayed. Sweetwater had 10,622 people at the 2020 census, which is roughly where the population has held since 1940, generally somewhere between 11,000 and 13,000. Source: Wikipedia, Sweetwater, Texas.
A town that size, with a wind farm that dense, is the kind of mismatch that’s easy to drive past without realizing what you’re looking at — a few hundred turbines turning on the horizon, quietly out-producing a state with 39 million people, at least for that one stretch in 2008.
So How Much Power Is That, Really?
Per the U.S. Geological Survey, the average wind turbine that came online in 2020 had a capacity of 2.75 megawatts and, at a 42% capacity factor (the average among recently built U.S. turbines, per the Department of Energy’s Land-Based Wind Market Report), generated more than 843,000 kWh a month — enough to power more than 940 average American homes for a month, based on the U.S. Energy Information Administration’s figure for average household electricity use. That’s a national average for a modern turbine, not a measurement of the specific GE, Siemens, and Mitsubishi units at Sweetwater, which are older and smaller than today’s typical new turbine, so any individual Sweetwater-era turbine likely produces less than that. Actual output always varies by turbine size, design, and local wind conditions — this is an illustrative average, not a precise count for any one machine. Additional context: U.S. Department of Energy, WINDExchange.
How Do You Even Build and Ship One of These?
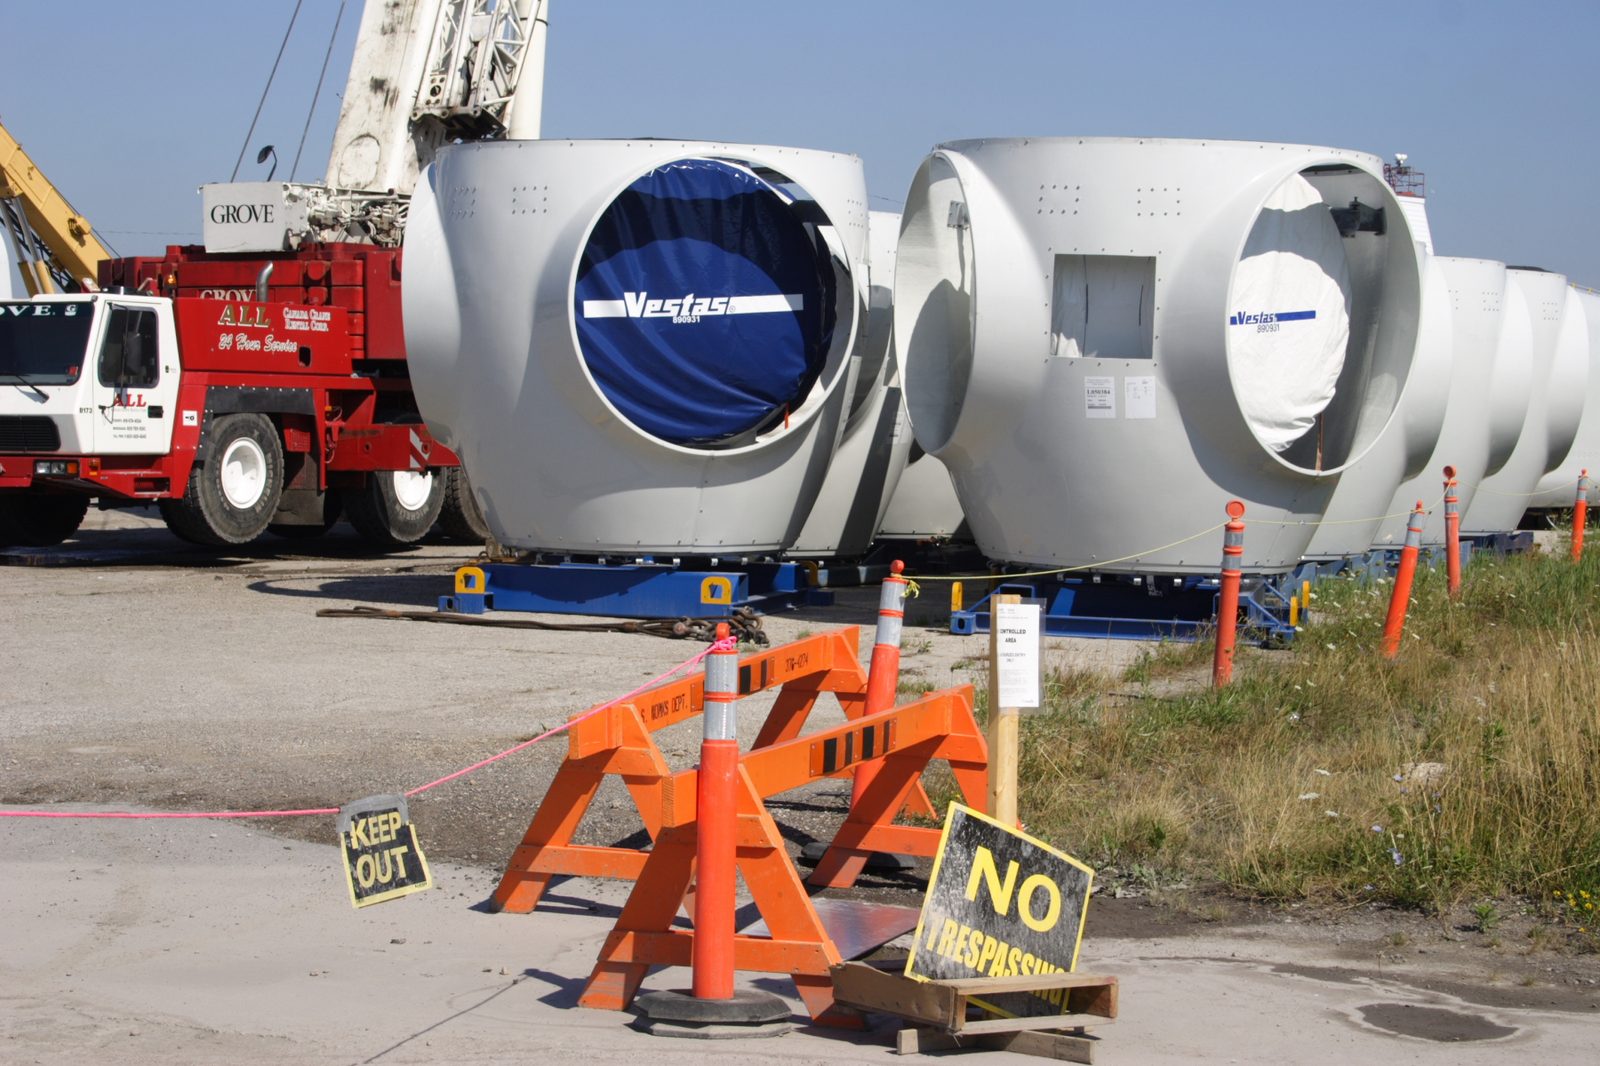
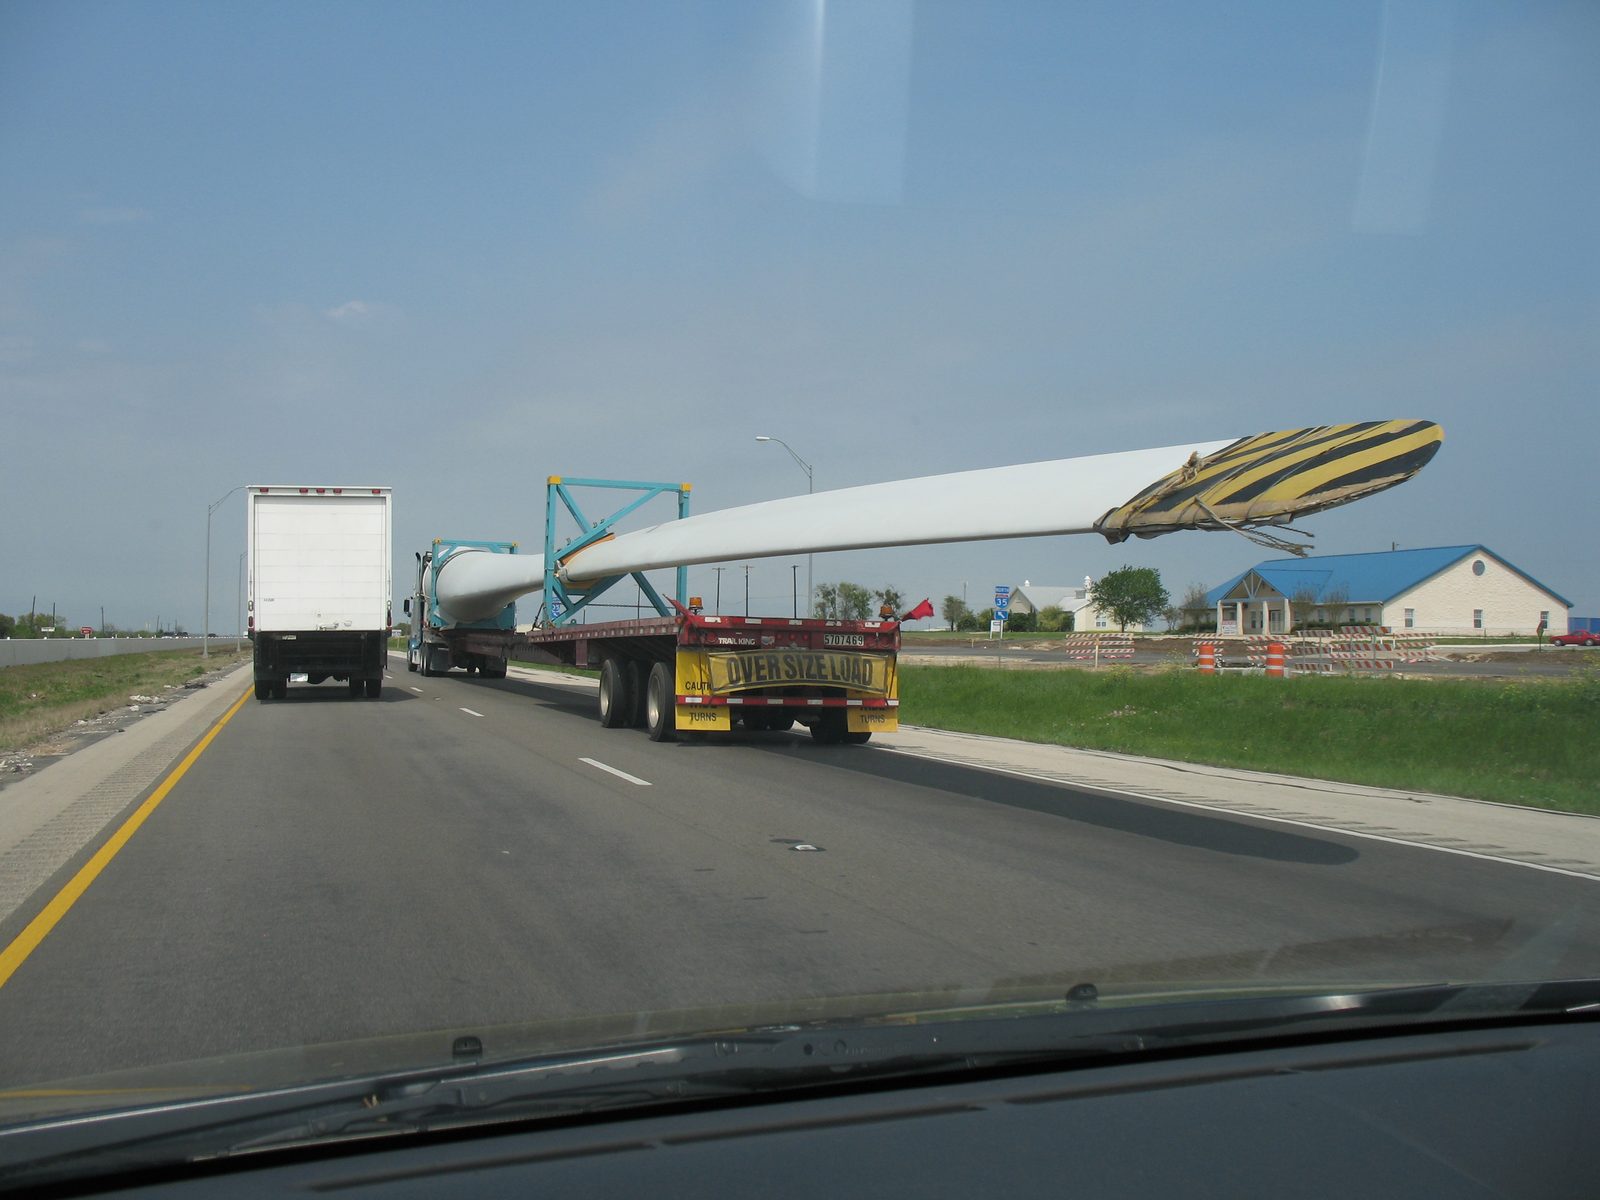
Turbines like the ones spinning over Nolan County aren’t built in one place and bolted together from a kit. Towers, blades, and the nacelle (the housing that holds the gearbox and generator) are typically manufactured at different, specialized factories and then shipped separately to the installation site. Blades are the biggest challenge: they’re manufactured in one piece, can run up to 100 meters (328 feet) long, and are largely built by hand because of their size and aerodynamic complexity. Source: U.S. Department of Energy, Advanced Blade Manufacturing.
Once built, a blade can’t be bent or folded for the trip, which limits both the routes a truck can take and how sharp a turn it can make — often forcing longer routes around tight corners, low bridges, and narrow town streets a hundred-foot-plus rigid blade simply can’t clear. Tower sections run into a related problem: their diameter can be too wide to fit under highway overpasses, which makes route surveys and oversize-load permitting their own project before a single piece ever reaches the site. The Department of Energy’s Big Adaptive Rotor project is specifically exploring flexible-blade designs partly to make it possible to ship future, even-longer blades by rail instead of by truck. Because of all this, manufacturers try to build components close to where they’ll be installed whenever they can — it’s simpler than hauling oversized parts across the country. Once the pieces do reach the site, crews stack the tower sections and lift the nacelle and blades into place with large cranes, assembling the turbine on location. Source: U.S. Department of Energy, Infrastructure and Logistics.
Where the Turbines Actually Are
Nolan County’s turbine density is a local extreme, but Texas as a whole is the undisputed national leader by a wide margin. Here’s a simplified, illustrative look at where wind turbines are concentrated across the lower 48, based on state-level turbine counts from the USGS/LBNL United States Wind Turbine Database (USWTDB), accessed October 2026. These are approximate snapshot totals, not a live count — turbines come online (and occasionally get decommissioned) all the time, so treat the numbers below as a sense of scale rather than today’s exact tally.
Map is a simplified, non-geographic schematic for illustration only — circle sizes and positions are approximate. Approximate turbine totals by state: Texas ~19,900 • Iowa ~6,500 • Oklahoma ~5,800 • California ~4,900 • Kansas ~4,400 • Illinois ~4,000 • Colorado ~3,300 • New Mexico ~2,900 • Minnesota ~2,700 • North Dakota ~2,300. Source: USGS/LBNL United States Wind Turbine Database (USWTDB), accessed October 2026. Figures are approximate and change as turbines are installed or retired.
Zooming into the two biggest states: here’s where the turbines actually sit within Texas and California, down to the county level.
Same simplified, non-geographic schematic approach as the map above — these two insets are not to scale and circle positions are approximate, not precise geographic placement. Texas counties by turbine count: Nolan 1,349 • Scurry 685 • Willacy 680 • Sterling 676 • Carson 611 • Pecos 581. California counties by turbine count, with the commonly used name for that wind-resource area where applicable: Kern 3,250 (Tehachapi Pass area) • Riverside 624 (San Gorgonio Pass area) • Solano 529 (Montezuma Hills area) • Alameda 148 (Altamont Pass area) • Imperial 112 • San Diego 83. Source: USGS/LBNL United States Wind Turbine Database (USWTDB), accessed October 2026. Figures are approximate and change as turbines are installed or retired.