
I was today days old when I asked a question while sitting in North Carolina: the South and cotton go way back, but North Carolina’s own history is textiles, and at some point U.S. policy broke U.S. textiles and the work went overseas. So is that the next step for AI processing, with data centers going the way of the mills? Or is it a long way off? This post tells the textile story first, then holds it up against Story #196’s ballot-box backlash. The comparison is mine, not an established claim. I found no one else making it directly.
This is not investment or policy advice. I am describing what happened and what sources said, and I am not telling anyone what to buy, build, vote for or oppose.
The Short Answer
- Not yet, and maybe never in the same way, but there are early signs.
- Textile work was labor-intensive and easy to move. AI compute is capital- and power-intensive and depends on chips the U.S. government controls exports of.
- But the pressure points are real: local pushback on new data centers, a U.S. power shortfall, and other countries courting the same buildout.
- Whether capacity actually drifts abroad is a forecast, not a fact. I mark everything I could not open as unverified below.
The Whole North Carolina Textile History, Dated

The rise (1813 to the 1970s):
- 1813: Michael Schenk builds the first textile mill in North Carolina, in Lincoln County. The first dam broke; he and Absalom Warlick rebuilt nearby in 1816.
- 1840: North Carolina has 25 textile mills. Rhode Island had 119 in 1832.
- 1880s: Southern mill wages were about 30 to 50 percent lower than New England’s (per historian David Koistinen, quoted by the NC History Project). Mills moved south, and New England lost business.
- 1923: North Carolina passes Massachusetts as the largest textile producer in the country.
- 1929: A fight between workers and management at the Loray Mill in Gastonia leaves two dead.
- 1934: Textile workers across the South strike for three weeks. They did not win higher wages or full work weeks.
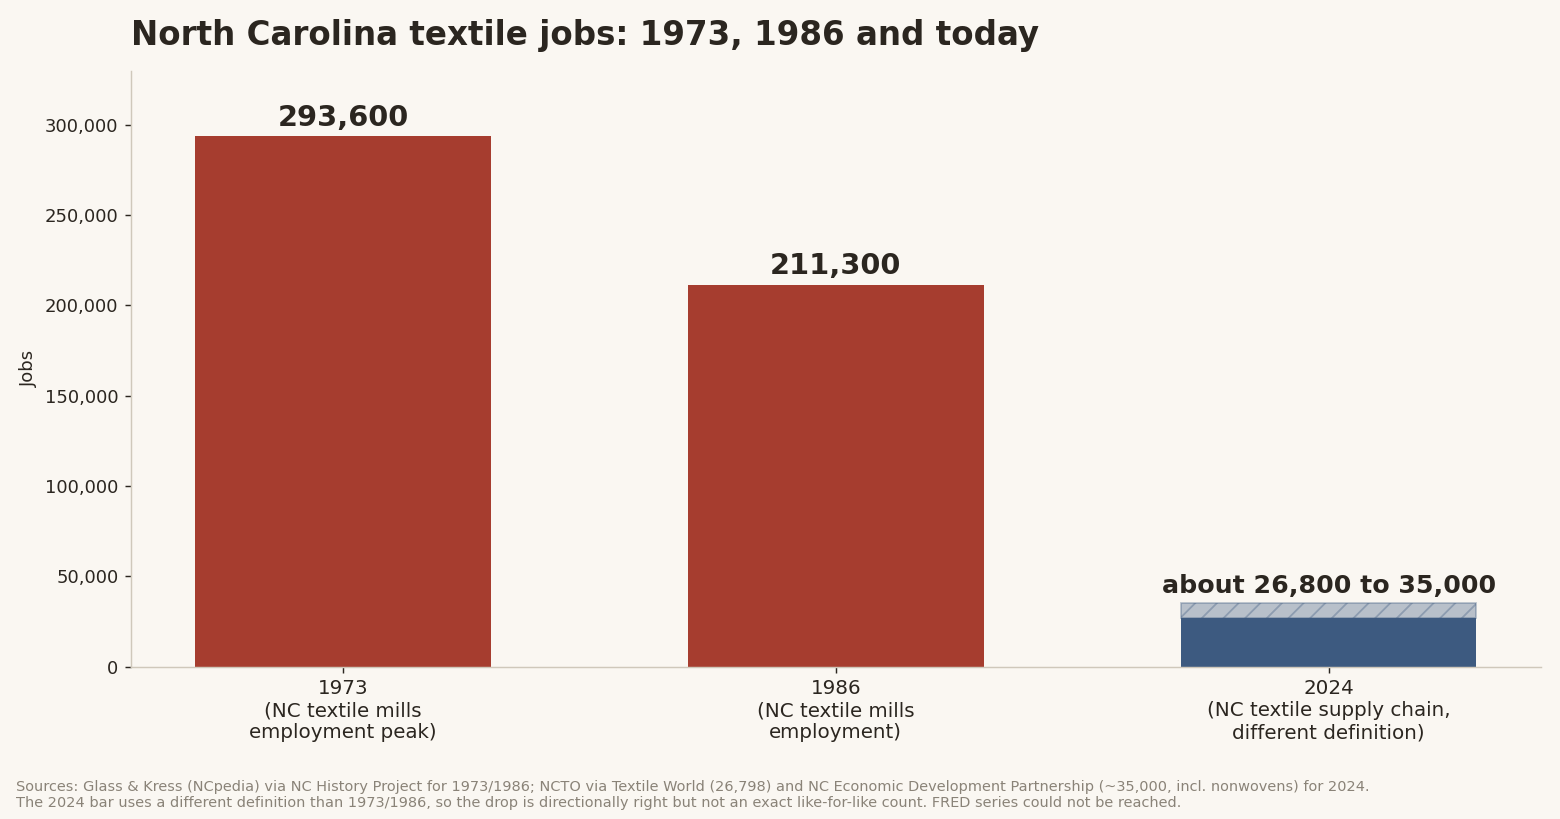
- 1973: North Carolina textile mill employment peaks at 293,600.
Source: NC History Project, The Textile Industry in North Carolina.
The long decline (1974 to 2005):
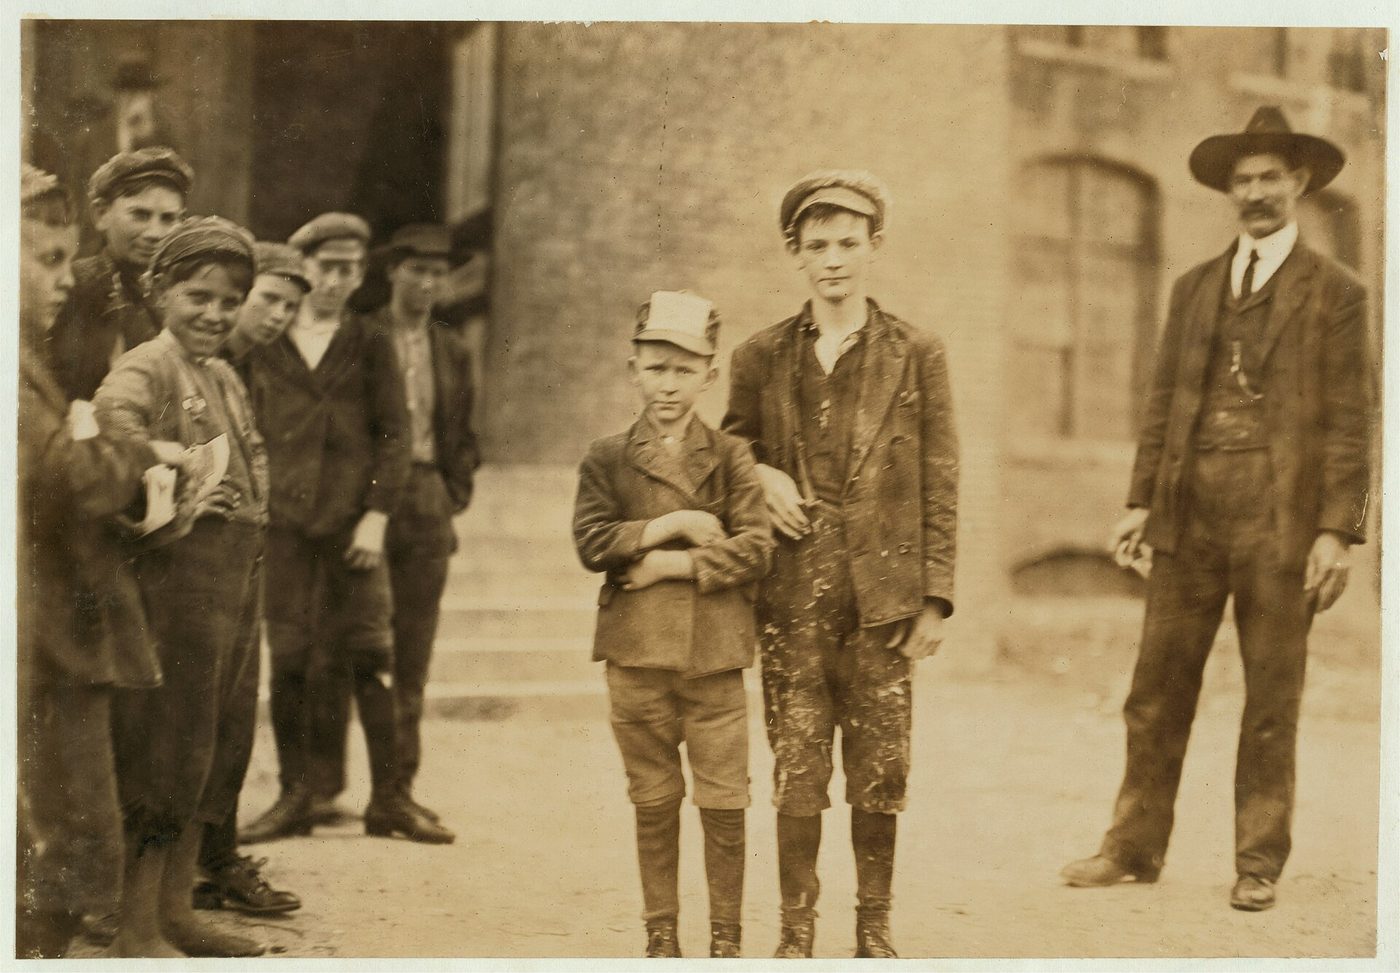
- 1974: The Multi-Fiber Arrangement begins regulating textile and apparel trade through quotas. This is background knowledge; I did not open a source for it, so treat the date as unverified.
- 1975 to 1985: More than 800 U.S. textile mills close. North Carolina mill employment falls to 211,300 by 1986 (Glass and Kress, as quoted by the NC History Project; their original is in the Encyclopedia of North Carolina on NCpedia, which blocked my request).
- 1985: Fieldcrest buys Cannon, the towel and bedding maker. Cannon’s Kannapolis plants were later sold to Pillowtex, in 1997.
- Sept. 28, 1988: President Reagan vetoes a textile trade bill, H.R. 1154. On Oct. 4 the House fails to override, 272 to 152 per Senate.gov and Voteview as I saw them in search summaries. Time reported a different tally, so the exact count is unverified.
- 1994: NAFTA takes effect. NCpedia ties it to rising textile and apparel imports and plant closings (via a summary; I could not open the page).
- 1997 to 2002: North Carolina loses about 100,000 textile jobs and about 70,000 apparel jobs (NCpedia, via a summary).
- 2001: China joins the World Trade Organization (background knowledge, not sourced here). Burlington Industries files Chapter 11 on Nov. 15, 2001 (search snippet only).
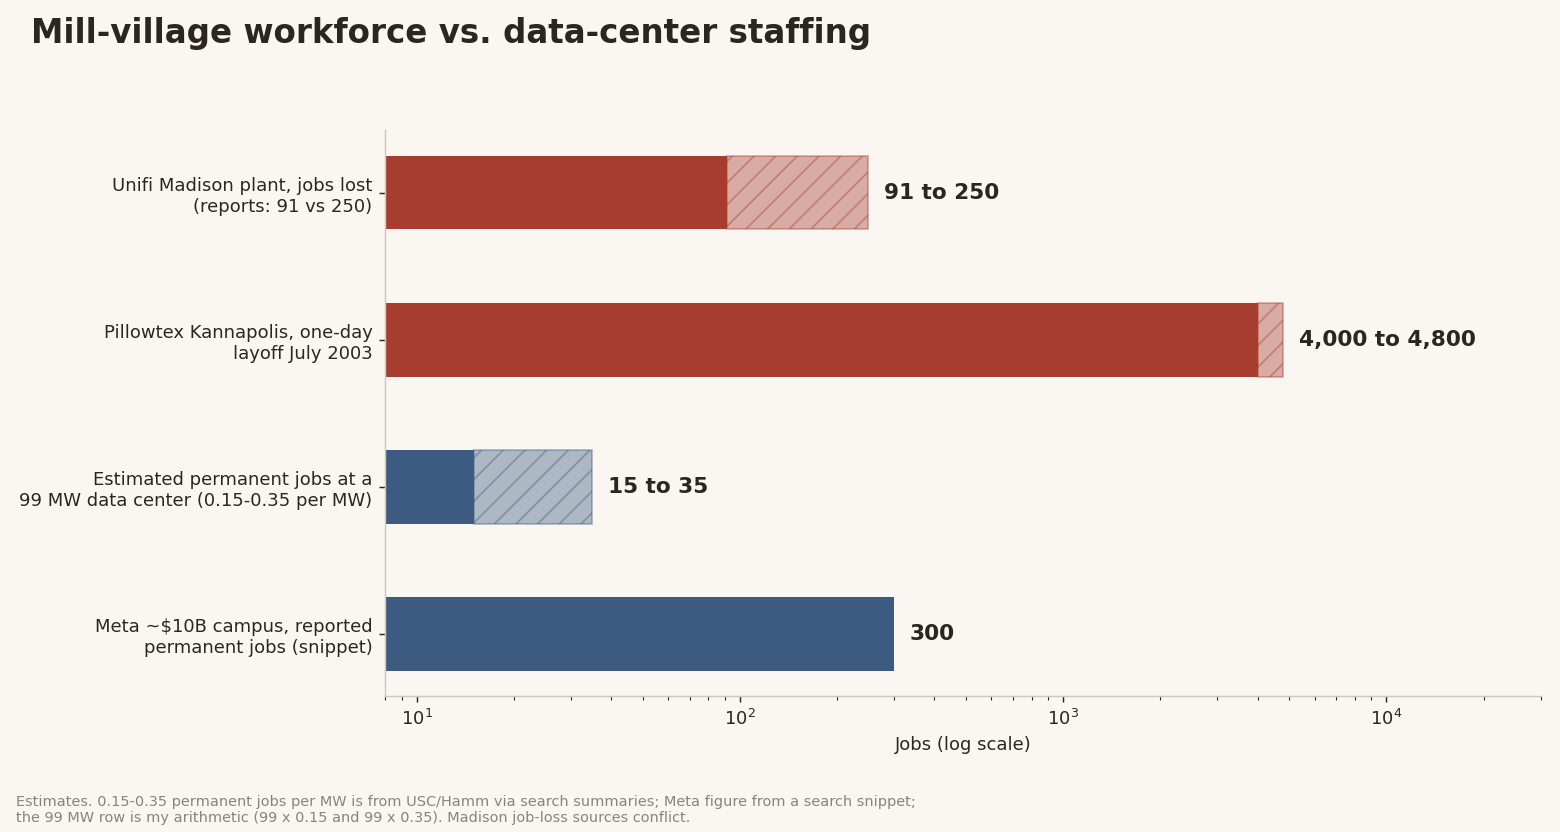
- July 30, 2003: Pillowtex closes. Estimates of North Carolina jobs lost range from 4,000 to 4,800, and the event is called the largest one-day layoff in state history. The NC History Project says “more than 4,000”; the Kannapolis city site reportedly says 4,340 locally; a UNC case study reportedly says about 4,800. The counts differ because they measure different things.
- 2003 to 2004: Burlington is sold to investor WL Ross; Cone Mills is also sold to Ross and merged into International Textile Group in 2004 (search snippets only).
- Jan. 1, 2005: The last textile quotas end. A National Bureau of Economic Research paper by Brambilla and Khandelwal reportedly found China’s textile and clothing exports to the U.S. rose 39% in 2005 (snippet only, so unverified).
Afterward:
- 2004 to 2006: The Pillowtex Plant One in Kannapolis is demolished (snippets give conflicting years). The North Carolina Research Campus, built around the Dole biotech effort, follows. Early backers promised 5,000 jobs; a 2013 local report said it struggled to meet expectations; a 2024 report gave affiliate employee counts of 1,111 versus 484, which is shaky and conflicts. All of this is from snippets, so unverified.
- 2017: International Textile Group closes the former Cone Mills White Oak denim plant in Greensboro after 112 years (snippet only).
So Who Broke It? Policy vs. Automation
This is where economists disagree, and where I would be careful about anyone who is certain. Every figure in this section comes from search summaries, not pages I opened, so treat them as unverified. Several cover all manufacturing, not textiles alone.
- Automation and productivity: Wake Forest economist Gary Shoesmith found North Carolina textile and apparel employment fell 22.6% in the 1990s, and attributed most of it to automation and productivity gains. He also argued NAFTA pushed mills to automate, and noted Mexico’s 1995 peso crisis.
- Trade as a smaller share across manufacturing: Ball State’s Center for Business and Economic Research puts trade at about 13% of lost U.S. factory jobs. A 2016 NC State speaker put it at roughly 20% globalization and 80% technology. Neither number is textile-specific.
- Trade advocates still see a policy break: The James Martin Center (2003, a free-trade advocate) said North Carolina textile and apparel losses rose from about 5,000 a year from 1973 to 1993 to about 15,000 a year after 1993.
- A fair summary: productivity growth was real and large, but textiles were also unusually exposed to imports, and the losses clustered after the 1994, 2001 and 2005 trade changes. I found no Autor, Dorn and Hanson-style study of textiles specifically, and I am not going to invent one.
The honest answer is “both, and I can’t give you a percentage.” Policy didn’t act alone, and automation didn’t either.
What’s Left Today
- NCTO (the textile trade group), via Textile World: 471,046 U.S. textile supply-chain jobs in 2024; 26,798 in North Carolina, second to Georgia’s 39,141; $63.9 billion in shipments and $28 billion in exports. I only saw this in a snippet.
- The NC Economic Development Partnership cited about 35,000 workers in 2024, including nonwovens (quoted by the NC History Project, which I opened). Both figures appear on the hero chart because the definitions differ.
- Even at 35,000, that is roughly an eighth of the 1973 peak of 293,600, though the later figures are not a like-for-like count.
Now the AI Side: Could Data Centers Follow?
Story #196 covered the November 3 ballot-box backlash. #195 asked whether the AI bubble was waiting for one pin, and #194 covered the two-day market reaction. Here I take the specific offshoring question.
The case for “early signs”:
- On Nov. 3, 2026, voters backed restrictions in 40 of 41 local data-center ballot measures; the one exception was Harwood, North Dakota (Scientific American).
- Gallup: 70% of Americans oppose AI data centers in their local area, as cited by AGSI. An Annenberg Public Policy Center poll in the same piece found local opposition rose from 49% to 61% over four months.
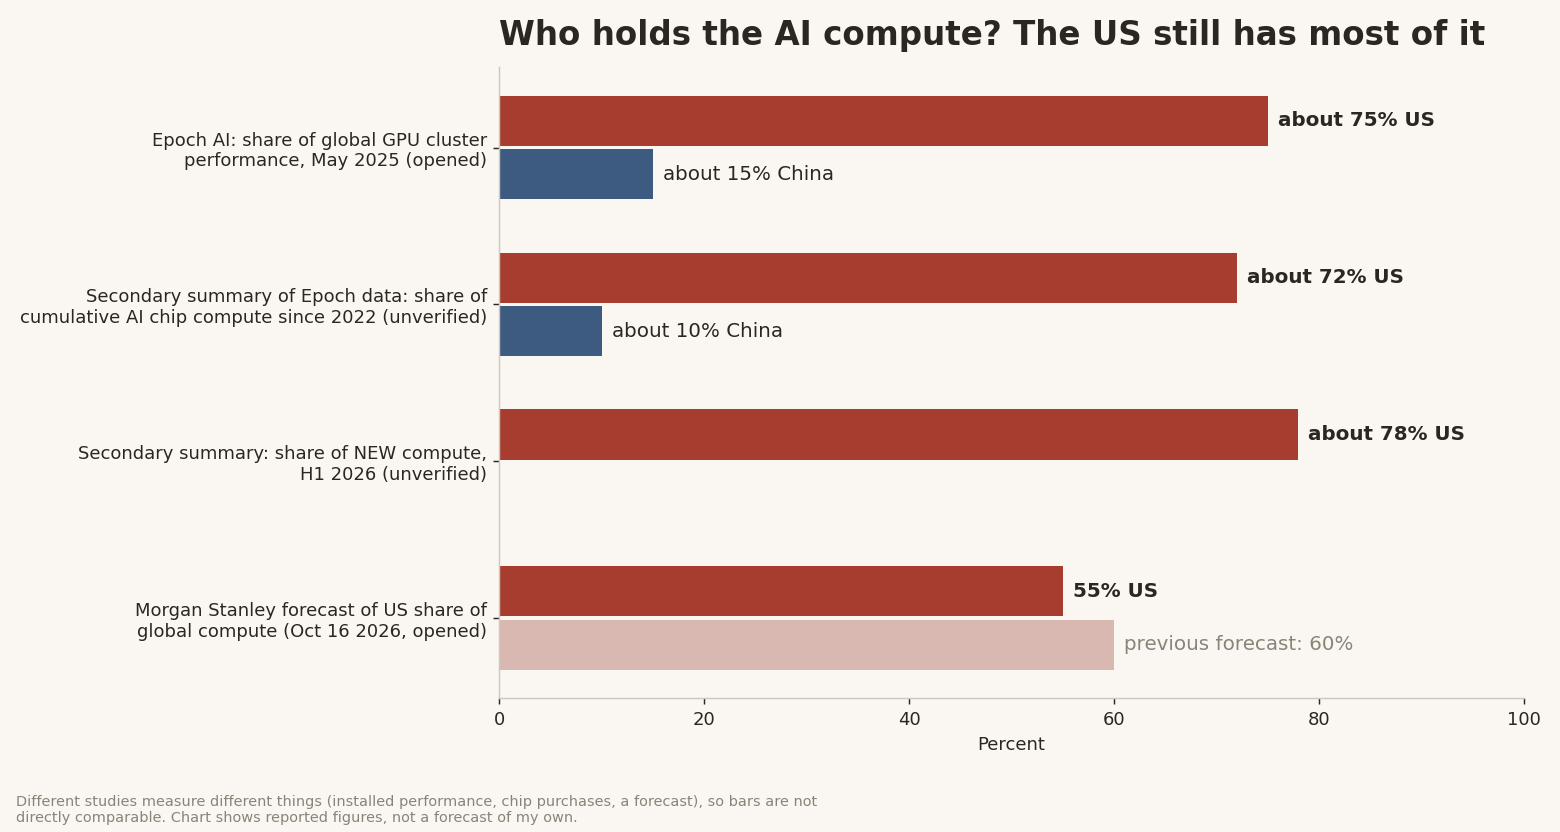
- Morgan Stanley (Oct. 16) cut its forecast of the U.S. share of global compute to 55% from 60%, citing a 32-gigawatt U.S. power shortfall from 2026 to 2028. It assumes about 14 GW of hyperscaler demand shifts to Asia by 2030 (as reported by NewKerala; I could not open the original note).
- Goldman Sachs reportedly sees a 45 GW shortfall by 2028 (snippet, unverified).
- China reportedly added roughly 445 to 543 GW of power capacity in 2025, with electricity at about 3 cents per kWh versus roughly a third higher in the U.S. (snippets, unverified).
- Other countries are building to host compute (AGSI): Saudi Arabia’s Humain aims to add 2 GW by 2030; the planned UAE-U.S. campus will eventually reach 5 GW, including a 1 GW Stargate UAE cluster with OpenAI, G42, Oracle and Nvidia. A Nvidia 2 GW project in Australia by 2027 is from a snippet.
- Sen. Chuck Schumer warned that the Saudi and Emirati chip agreements risk “cannibalizing the U.S. buildout of AI” (AGSI).
- The U.S. imported about 71% of its large-transformer demand in 2023 (USITC, via AGSI), so parts of the physical supply chain are already abroad.
Source: Scientific American. Source: AGSI. Source: NewKerala (Morgan Stanley).
The case for “a long way to go”:
- Epoch AI: as of May 2025 the U.S. held about three-quarters of global GPU cluster performance, China about 15%, and Germany, Japan and France only marginal roles (I opened this one). A secondary summary of Epoch data, which I could not confirm, put the U.S. at about 72% of cumulative AI-chip compute since 2022, about 78% of new compute in the first half of 2026, and China near 10%. These are different measures, so the numbers are not interchangeable.
- Even Morgan Stanley’s cut leaves the U.S. at 55%, a majority. The report said overseas expansion is unlikely to fully offset the U.S. shortfall because Europe, the Middle East and Asia each face constraints (power, permitting, geopolitics, coal in Asia).
- Data centers are not labor-intensive. Estimates of about 0.15 to 0.35 permanent jobs per megawatt (USC, via snippets) and about 300 jobs at a $10 billion Meta campus (snippet) are unverified. If they hold, the real loss from a move abroad would be construction work and tax base, not a mill-village workforce.
- Export controls, latency, security and data-sovereignty concerns tend to keep frontier training in friendly jurisdictions. That is my reasoning, not a number I measured.
- Chips were never made in the U.S. to begin with. The advanced ones come from Taiwan, so that part of the “offshoring” already happened.
Source: Epoch AI. Source: NewKerala (Morgan Stanley).
The Best Hook: A Textile Plant in Madison, NC Is Becoming a Data Center
The story that made me ask the question is already happening in North Carolina. A textile plant is being rebuilt as AI infrastructure. It is not offshoring, but it is the same building changing what it makes.
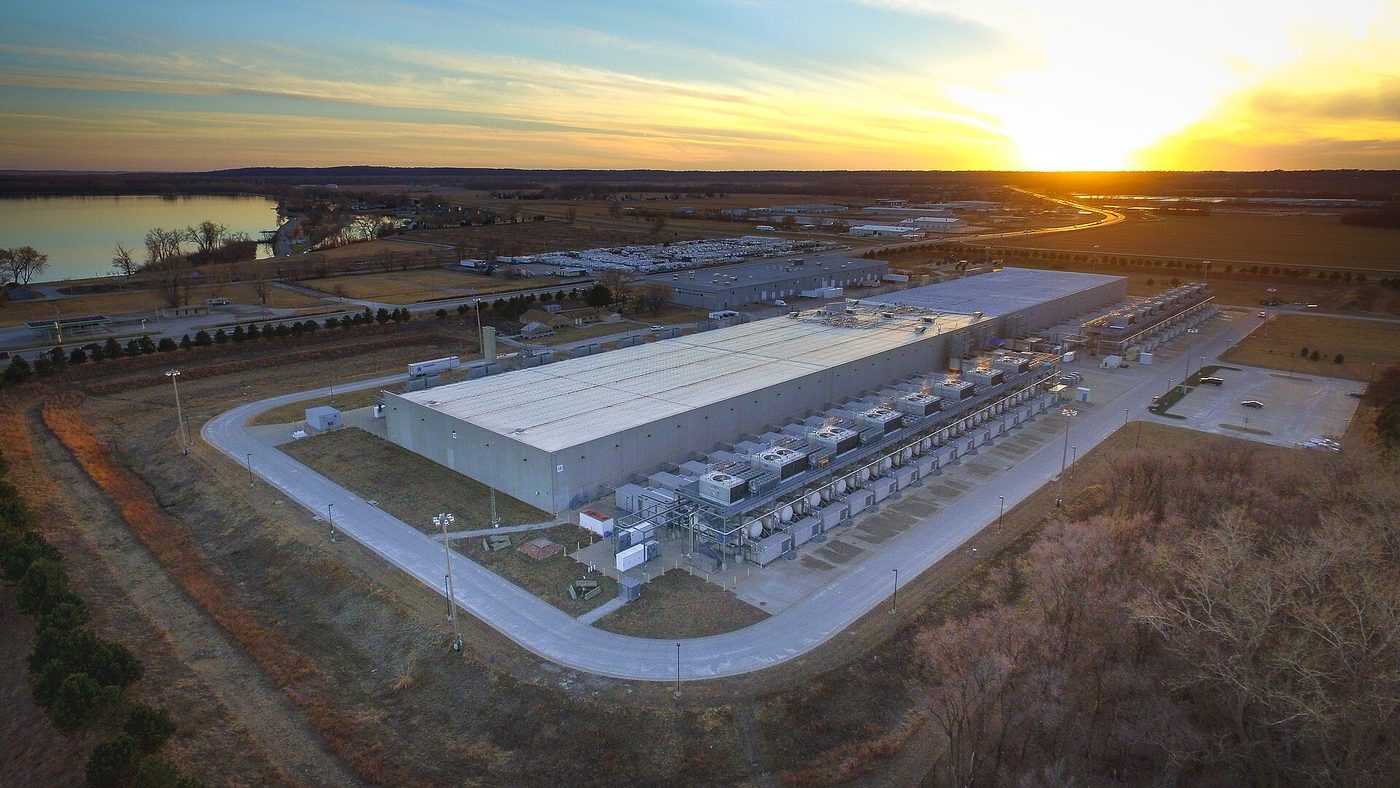
- The plant: Unifi closed a 946,585-square-foot plant in Madison, NC, in February 2025 as part of a footprint reduction. Data Center Dynamics says 91 workers were laid off, while CNN reportedly said 250 jobs vanished. The sources do not say whether the two numbers measure different things.
- The buyer: WhiteFiber bought the roughly 96-acre site in June 2025 for about $45 million in cash (another source says $52.3 million, which I could not confirm).
- The project: a 99 MW data center called NC-1, expandable to 200 MW. WhiteFiber reported in May 2026 that Duke Energy had delivered 54 MW of gross utility power.
- The customer: a 10-year, $865 million colocation deal with Nscale, announced in December 2025, covers 40 MW of IT load, and Nscale could double its deployment over two years (Data Center Dynamics).
- Jobs: I found no permanent-jobs figure for NC-1. Using the jobs-per-megawatt estimate above, a 99 MW site might employ something like 15 to 35 people. That is my arithmetic from an unverified estimate, not a reported number.
- Status: sources disagree on whether it is already live or still being rebuilt. The Let’s Data Science summary says public reporting documents a redevelopment project with an announced Nscale colocation arrangement “rather than a completed 99 MW AI deployment.” I could not open WhiteFiber’s own press release.
- Why it matters: a closed U.S. mill is being replaced by U.S. compute, in the same place, partly because the building and grid connection already exist. That is the opposite of the offshoring story, at least for now.
Source: Data Center Dynamics. Source: Let’s Data Science (summarizing CNN and DCD).

My Verdict, Hedged
- Not yet, and perhaps never in the same way. Textile work was labor-intensive and mobile. Compute is capital- and power-intensive and tied to chips the U.S. controls.
- But the pressure points are real: local opposition, a power shortfall, and other countries building aggressively for the same customers.
- The better parallel may be pace and exposure, not the product. The mills left over decades, in steps, after policy changes that were each argued over. If AI capacity drifts, expect something similar, with different winners.
- Whether capacity actually drifts abroad is a forecast, not an established fact. Morgan Stanley’s own number is still a U.S. majority.
What I Still Don’t Know, and What to Watch
- How much of the NC textile loss was policy and how much was automation. Economists disagree and I found no textile-specific study.
- Whether the Madison plant is live, what it will employ, and whether its tenant stays.
- Whether the new governors’ pauses in Texas, Ohio and Georgia turn “slower” into “elsewhere.”
- Whether Morgan Stanley’s 14 GW shift to Asia by 2030 turns out too high or too low.
- What to watch: the next Morgan Stanley and Epoch AI share figures, further Gulf and Asian project announcements, Duke Energy and other utility interconnection decisions, and any export-control changes on chips.
Related Reading
- Story #196: voters told the AI industry no at the ballot box.
- Story #195: was the AI bubble waiting for one pin?
- Story #194: why the post-midterm drop took two days.
Sources I Opened, and the Ones I Couldn’t
- Opened and checked: NC History Project (textile history, 1973 and 1986 job counts, 35,000 figure), Scientific American, AGSI, NewKerala (Morgan Stanley), Epoch AI, Data Center Dynamics (Nscale deal) and Let’s Data Science.
- Could not open: NCpedia (blocked), the FRED series for NC textile employment (timed out, so the chart uses discrete points), WhiteFiber’s own press release, and the Senate.gov, Voteview, Time, Textile World, NBER and CNN pages. Anything attributed only to them, or to search summaries, is marked unverified above.
- Not sourced at all: the 1974 Multi-Fiber Arrangement date and China’s 2001 WTO entry (background knowledge). I left out the 1834 Mount Hecla mill date because I could not confirm it.
- Numbers that conflict: Pillowtex job losses (4,000 to 4,800), Madison job losses (91 vs 250), Madison purchase price ($45 million vs $52.3 million), and 2024 North Carolina textile jobs (26,798 vs about 35,000).
- The textile-to-data-center offshoring comparison is my own. A June 2026 piece by Frank Diana (“The Data Center Is The New Factory Town”) is about factory towns and power, not offshoring, and I only saw it in a snippet.
- Nothing here is investment or policy advice.