
I was today days old when I realized I’d been walking around with a fully formed stock market thesis that I had never actually checked. It goes like this: a major correction is coming, built on four planks.
- The trigger is the financial reality of AI finally catching up with the hype.
- The economy feels funky: inflation won’t quit, the job market has cooled, and housing affordability has cratered.
- The strip clubs are supposedly empty.
- The midterms are days away with Democrats likely to retake at least part of Congress, which my gut says means tax-hike fears and a selloff.
Four planks, one conclusion. The problem is that gut feelings are cheap and data is not, so I spent the day chasing down each plank to see whether it holds up. Some of it does. One piece of it very much does not.

Plank 1: AI’s Financial Reality Is About to Hit — See Google
The thesis: the AI buildout is costing more than it’s earning, and the market is going to notice all at once. What the data says: it noticed on Wednesday.
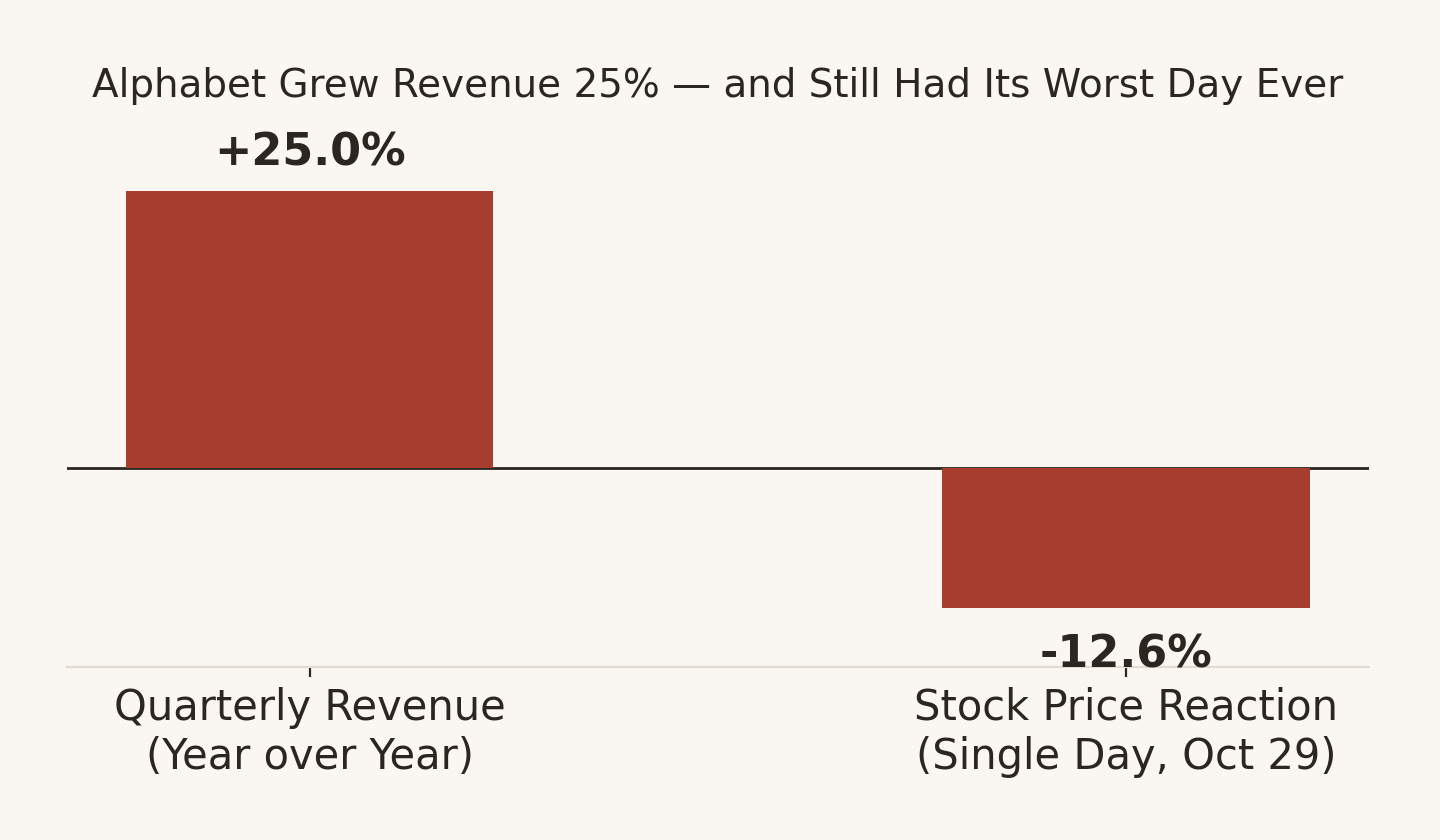
- On October 29, Alphabet had the worst single day in its history as a public company, falling 12.6% and erasing roughly $497 billion in market value.
- That happened despite Alphabet reporting quarterly revenue up 25% year over year.
- The problem wasn’t the top line — Search ad growth is slowing while Alphabet spent $51.4 billion on property and equipment in a single quarter, pushing free cash flow to negative $9.1 billion.
- Investors aren’t convinced that AI Mode search queries will monetize anywhere near as well as the classic ten-blue-links ads did.
Source: CNN. Source: 9to5Google.
Does it support the thesis? Strongly, for this plank. A half-trillion-dollar one-day haircut on a company that is growing revenue 25% is the market saying, out loud, that it has stopped giving AI spending the benefit of the doubt. It also rhymes with what I wrote about a day earlier: the circular compute deals and the Anthropic S-1 both show money flowing around the AI industry faster than anyone can prove it’s coming back. The honest caveat is that this is one company and one day. A correction in AI-capex names is not the same thing as a correction in the market. But if I’m looking for the plank with the hardest, most current evidence behind it, this is it.
Plank 2: General Funkiness — Inflation, Jobs, and Housing
The thesis: the economy is wobbling and inflation is the clearest symptom. What the data says:
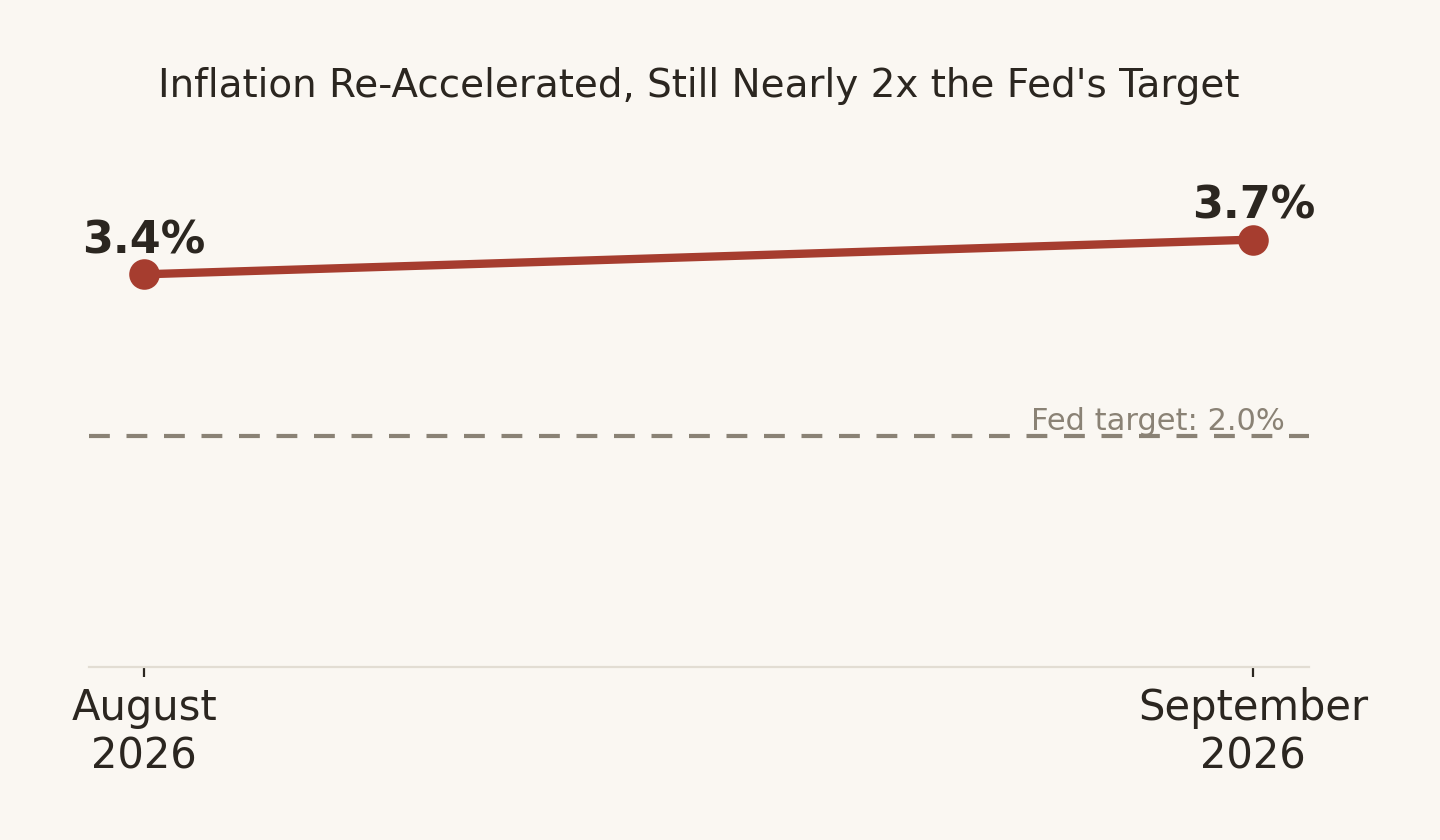
- The September inflation reading, released October 14, came in at 3.7% year over year, up from 3.4% in August.
- That’s still well above the Federal Reserve’s 2% target.
- The October number lands on November 10.
Source: Advisor Perspectives.
It’s not just prices, either. The job market and the housing market both look meaningfully different than they did a few years ago, so I pulled those numbers too.
- Unemployment ticked up to 4.2% in September 2026. That’s mostly a rounding-level move from August rather than a sharp jump, but it’s well above the 2019 average of about 3.7%.
- The economy added just 29,000 jobs in September, far below what economists expected.
- The BLS’s job openings survey (JOLTS, released September 29) counted about 7.1 million openings at the end of August, which works out to roughly one open job per unemployed worker. In 2019 it was about 1.2.
- Layoffs in that same survey rose to nearly 1.9 million, the highest since January 2023, though September itself saw a pullback, with employers cutting just over 43,000 jobs, an 18% drop from August. The trend is choppy, not a clean line up.
- The overall read from people who watch this for a living is “stable but fragile”: hiring is flat, unemployment isn’t falling, and what job growth exists is concentrated in a narrow set of sectors rather than spread across the economy.
Source: Indeed Hiring Lab. Source: Al Jazeera.
- The average 30-year fixed mortgage rate hit 7.40% around October 15, its highest since November 2023, before easing to about 7.32% by October 22. A year earlier it was around 6.17%.
- The monthly payment on a median-priced home reached $2,313 as of October 15, the highest in ten years and more than double the $989 payment on a median home in February 2021.
- Existing-home sales are near three-decade lows, months of supply is the highest in ten years, and builders are cutting prices to move inventory.
- Prices themselves are closer to flat than falling: the national median was about $410,700, only roughly 1% above a year earlier, with real regional divergence (some states still rising mid-single-digits, others like Texas slightly declining).
Source: WorldPropertyJournal / Cotality. Source: RealEstateNews.com.
Does it support the thesis? Partly, and more than I expected before I pulled the jobs and housing numbers, but it still isn’t one clean story. Inflation re-accelerating rather than cooling is a real problem, because it ties the Fed’s hands on rate cuts and squeezes exactly the consumers I’m about to talk about in Plank 3. The housing numbers are the sharpest version of that squeeze: a $2,313 monthly payment on a median home, up from $989 five years ago, is the kind of thing that reshapes household budgets. But notice what hasn’t happened. Home prices are roughly flat, not crashing, so this is an affordability-and-activity problem, not a 2008-style balance-sheet problem. The job market is the same shape: weakening, with fewer openings per job seeker than before the pandemic and layoffs at a multi-year high, but 4.2% unemployment and 29,000 new jobs is a stall, not a collapse. Put together, this plank describes an economy that has lost its cushion. Everything that used to absorb a shock, from cheap mortgages to a hiring boom to falling prices, is gone or going. That makes a correction easier to trigger. It still doesn’t tell me what the trigger is or when it fires, and “above-target inflation” has been true for most of the past five years while the market climbed anyway. So I’d upgrade this plank from “weak evidence a correction is imminent” to “solid evidence the economy is fragile enough that one wouldn’t need much of a push.” Supporting evidence, not a trigger.
Plank 3: The Strip Club Indicator (and Its Cousin, the Restaurant Check)
The thesis: when business dries up at strip clubs, a recession is coming, and restaurants should show the same pattern. Let me be upfront about what the strip club indicator is: folk economics. It’s an informal signal people cite because discretionary cash spending shows up there fast, not a series any government agency tracks. With that caveat, here’s what the data says:
- Las Vegas strip club revenue is reportedly down roughly 12%, with thinner tipping.
- Sixty-eight percent of consumers say they’re cutting back on dining out.
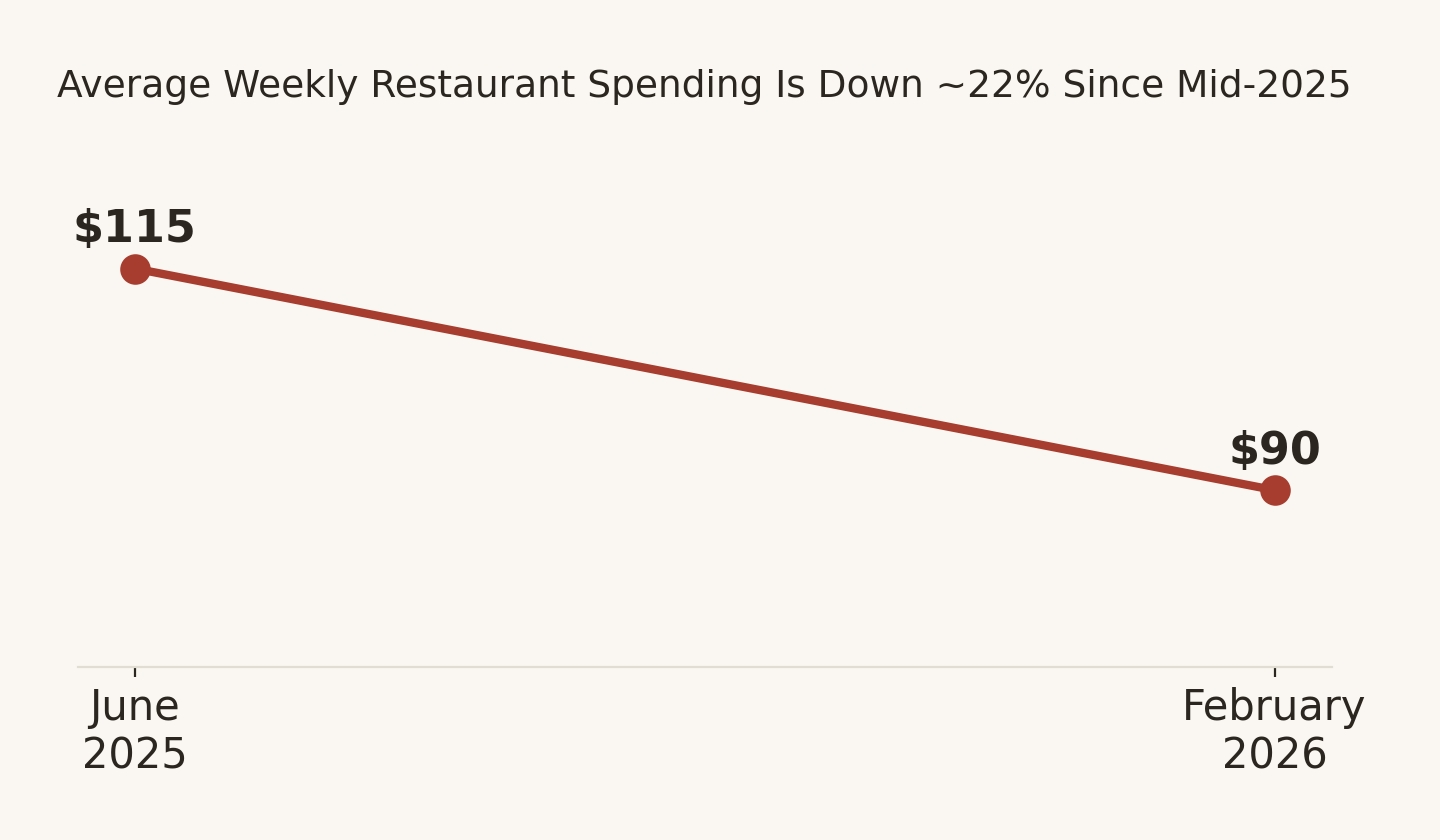
- Average weekly restaurant spending fell from about $115 in June 2025 to roughly $90 by February 2026.
- The industry has logged four straight months of same-store sales and traffic declines, with the deepest pullback among lower-income and Gen Z diners.
Source: Nation’s Restaurant News.
Does it support the thesis? Yes for the consumer, less clearly for the stock market. A $25-a-week drop in restaurant spending, concentrated among people who were already stretched, is exactly what you’d expect from Plank 2’s inflation, and it is a real sign that discretionary budgets are tightening. But the stock market isn’t a dining-out index. The S&P 500 is increasingly a bet on a handful of giant tech companies (see Plank 1), and those companies’ fortunes don’t move much on whether Gen Z orders the appetizer. This plank tells me a consumer slowdown is underway. It doesn’t tell me the market has to follow.
Plank 4: Democrats Take Congress, Markets Fall on Tax Fears
The thesis: a Democratic takeover in the midterms spooks investors about higher taxes and the market drops. This is the plank I was most confident about going in, and it’s the one that fell apart. What the data says:
- Since 1950, the S&P 500 has risen in every single one of the 19 years following a midterm election, averaging roughly 21% gains, with zero losing years.
- Going all the way back to 1874, it has climbed in 32 of the last 38 post-midterm years.
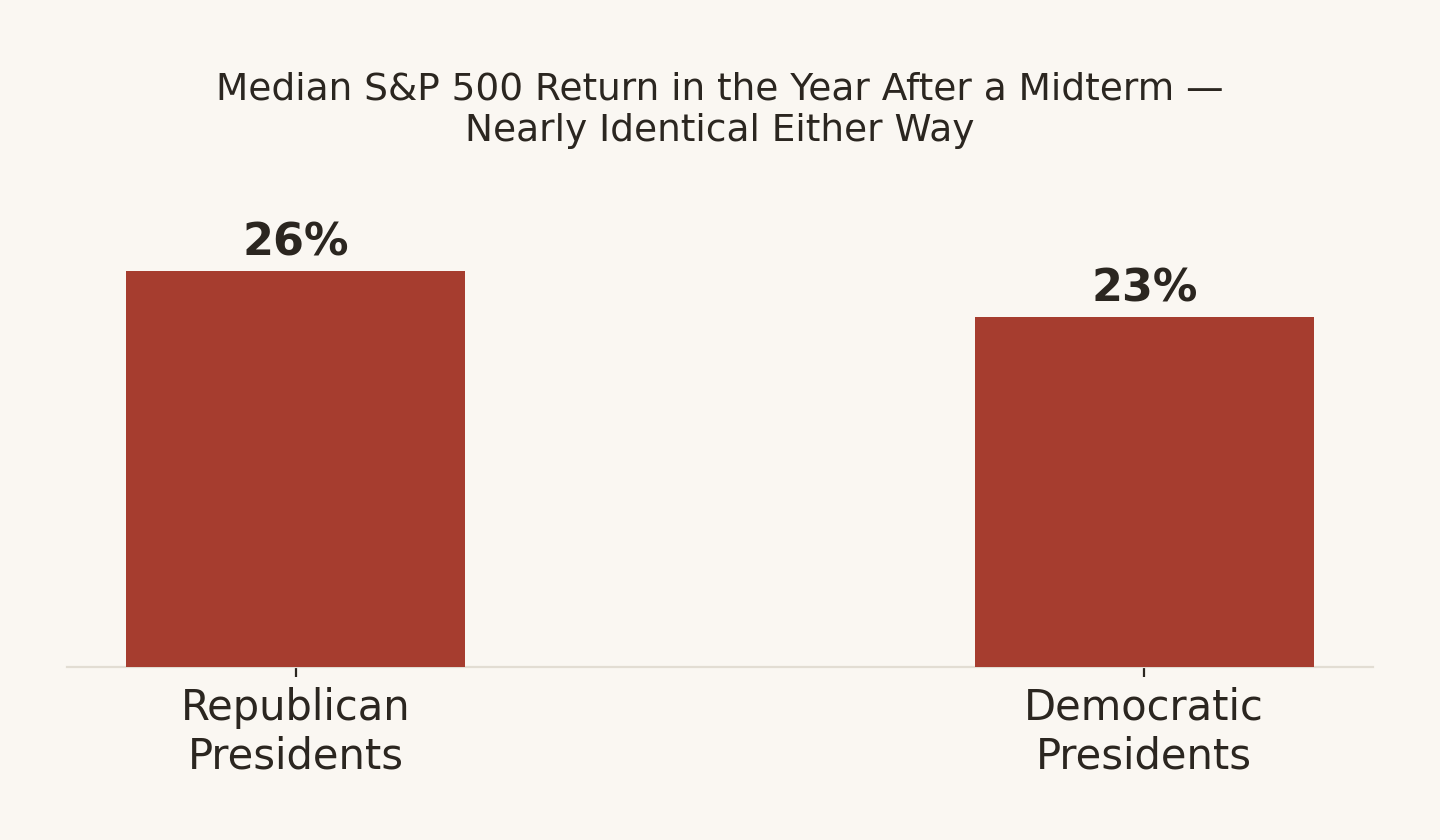
- It doesn’t appear to matter who wins — median post-midterm returns are about 26% under Republican presidents and 23% under Democratic ones.
- Divided government versus unified government produces nearly identical average returns: +14.6% versus +14.9%.
- Zoom in on the days right around election day itself and the pattern holds there too: going back to 1934 (23 midterm elections), the S&P 500 has risen in 22 of 23 cases in the window from five trading days before the vote to two days after, averaging a +2.74% gain. The one exception was 1994 — and that five-trading-day window for this year’s election starts right about now.
Source: Yahoo Finance. Source: Motley Fool. Source: Yahoo Finance.
Does it support the thesis? No. It undercuts it about as hard as historical data can undercut anything. The “Democrats win, taxes rise, stocks fall” story is intuitive, and it is apparently just not how markets have behaved. A party flipping Congress produces divided government, and divided government has done essentially the same as unified government. The historical pattern is that markets care about earnings and the economy, not which party holds the gavel. Nineteen for nineteen is not a guarantee about the twentieth, and past seasonality can break. But if I’m going to lean on history for one plank, I don’t get to ignore it for another, and this is the single most reliable pattern on the whole list.
The Verdict
Here’s where I land after a day of this, plank by plank:
- AI capital spending has outrun the market’s patience — this one is real, and Google’s worst day ever is proof the bill is already being presented.
- Inflation is drifting the wrong way, hiring has stalled, and a median-home mortgage payment has more than doubled since 2021 — the economy has lost its cushion, though none of that is a trigger on its own.
- Consumers, especially those at the bottom, are pulling back in ways you can see in restaurant receipts and, if you trust the folk indicator, in Las Vegas tip jars — real, but not the kind of thing that moves a market dominated by a handful of giant tech companies.
- The midterm pattern argues, with a century and a half of data behind it, that the twelve months after an election like this one are historically among the best stretches the market has, regardless of which party wins — and that history argues against a broad correction, not for one.
So my honest opinion: expect a painful, concentrated correction in the companies that spent the most on AI with the least to show for it, and don’t expect it to turn into the broad crash my gut was telling me about. I’ll check back after November 10’s inflation print and after the votes are counted. If I’m wrong, I’d rather be wrong on the record than right in my head.